Project · 2022 - 2023
SolarWinds Hybrid Cloud Observability
Infrastructure Telemetry
Polling and metric-processing services, SWIS/SWQL queries, cloud integrations, and anomaly scoring that turn network and server telemetry into performance dashboards and alert analysis.
- Task & inputs
- Network and server metrics, SNMP/WMI observations, cloud discovery results, and alert history.
- Method
- Developed polling and metric-processing services, SWIS/SWQL queries, cloud integrations, and anomaly scoring.
- Deliverables
- Performance dashboards, normalized infrastructure metrics, alert analysis, and regression checks.
- Technologies
- C#
- .NET
- SQL Server
- SWIS/SWQL
- Angular
- Python
- scikit-learn
- AWS
- Azure
- scheduled polling success rate, improved across 5,200 devices
- 98.7%successscheduled polling success rate, improved across 5,200 devices
- historical metric query latency in representative workloads
- 27%lowerhistorical metric query latency in representative workloads
The product
SolarWinds launched Hybrid Cloud Observability in April 2022 as a single observability product “built on the SolarWinds Platform,” offered in Essentials and Advanced editions with built-in AIOps and dependency mapping. It brings network, server, application, and database monitoring for on-premises and cloud resources into one place; today SolarWinds offers it as SolarWinds Observability Self-Hosted.
Under the hood, the platform’s polling engine queries devices over SNMP, WMI, ICMP, and APIs, stores results in Microsoft SQL Server, and exposes data through the SolarWinds Information Service (SWIS) and its SQL-like query language SWQL.
The problem
IT administrators need one trustworthy view of network performance, server health, and alerts across on-premises and cloud environments. That depends on three things working together: reliable telemetry collection from thousands of devices, fast access to historical metrics, and alerting that highlights genuinely abnormal behavior instead of noise.
What I built
- Discovery & polling services (C#/.NET): automated network discovery, scheduled SNMP and WMI polling, device health monitoring, and metric processing with asynchronous execution, configurable retry logic, and fault handling. Result: scheduled polling success improved to 98.7% across 5,200 devices.
- Historical data access (SQL Server, SWIS/SWQL): T-SQL, stored procedures, indexing, and execution-plan tuning, plus REST APIs and SWIS integrations with SWQL for historical performance metrics, device relationships, and alert records. Result: 27% lower historical metric query latency in representative monitoring workloads.
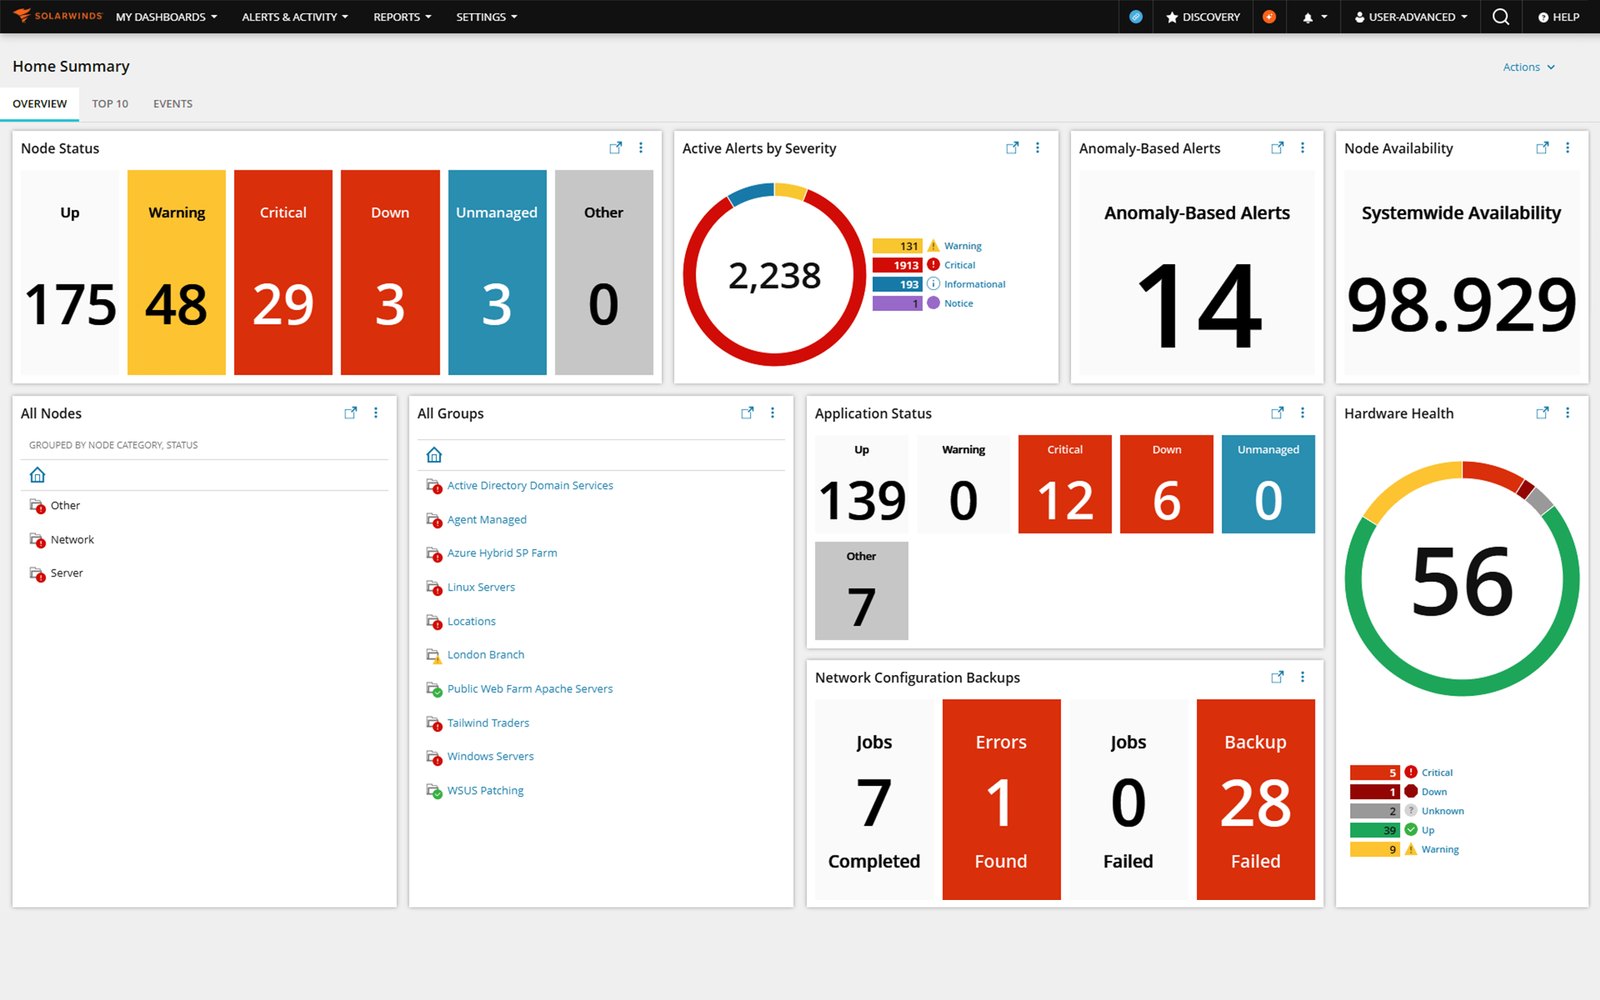
- Monitoring dashboards (Angular/TypeScript): configurable performance widgets, time-series charts, device-level filtering, and alert investigation views for CPU utilization, memory consumption, network latency, and infrastructure availability.
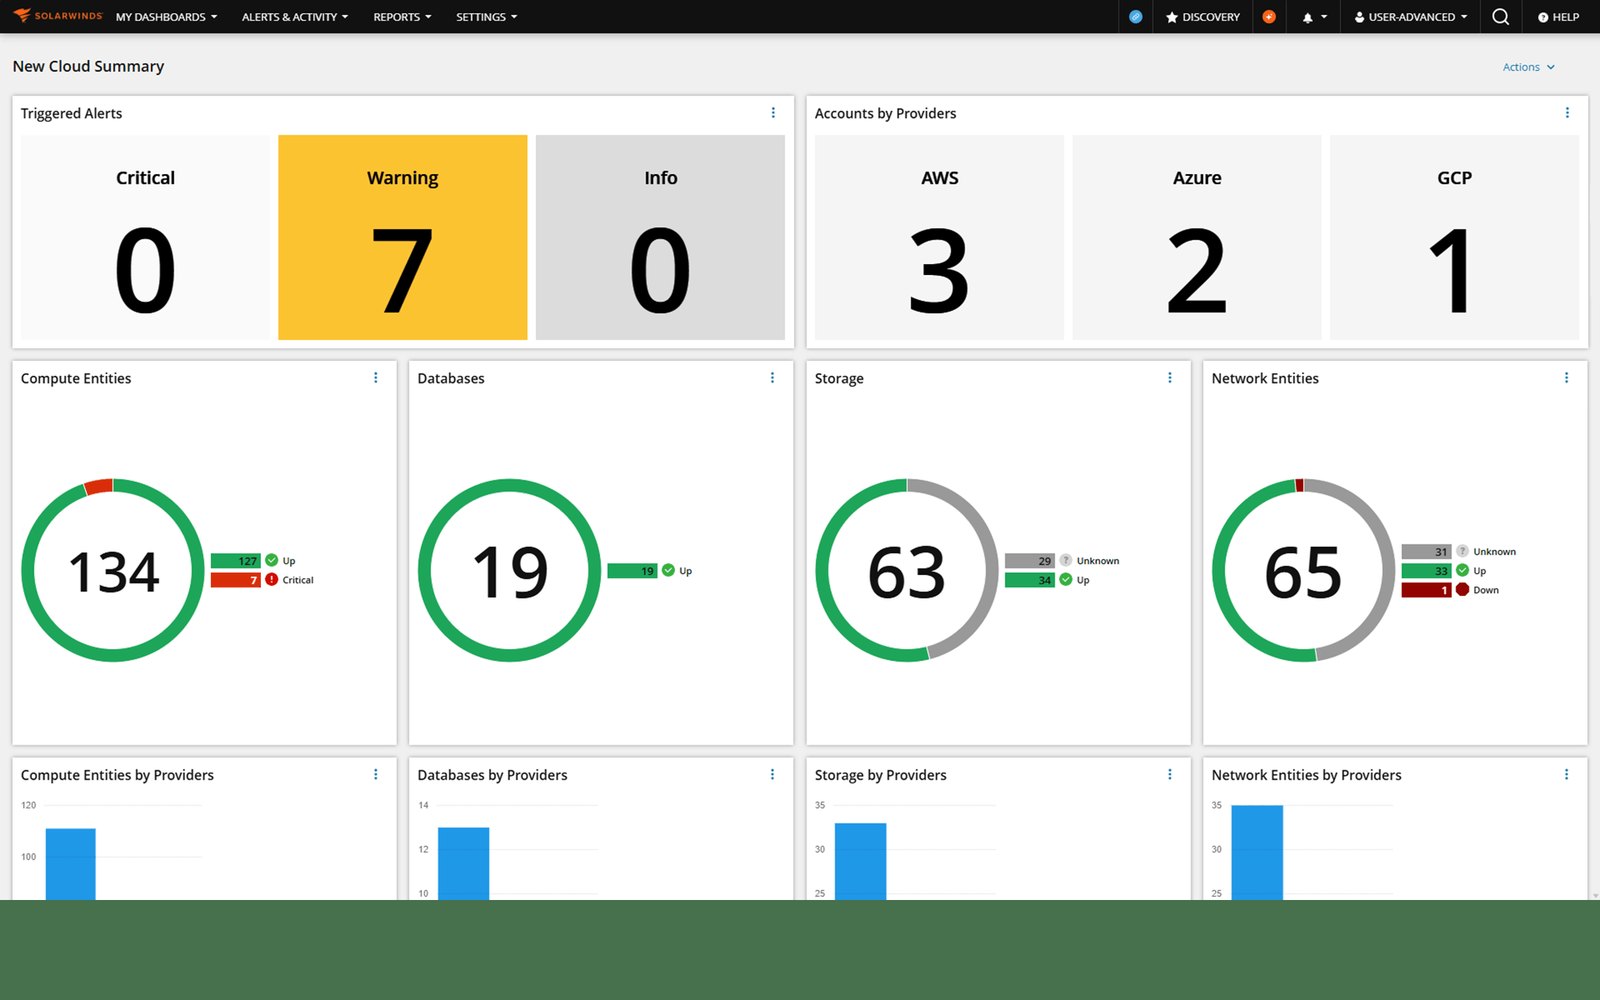
- Hybrid cloud integration (Python, AWS, Azure): automation for cloud resource discovery, telemetry normalization, and monitoring data validation, connecting cloud metrics with existing SolarWinds Platform entities and reporting workflows.
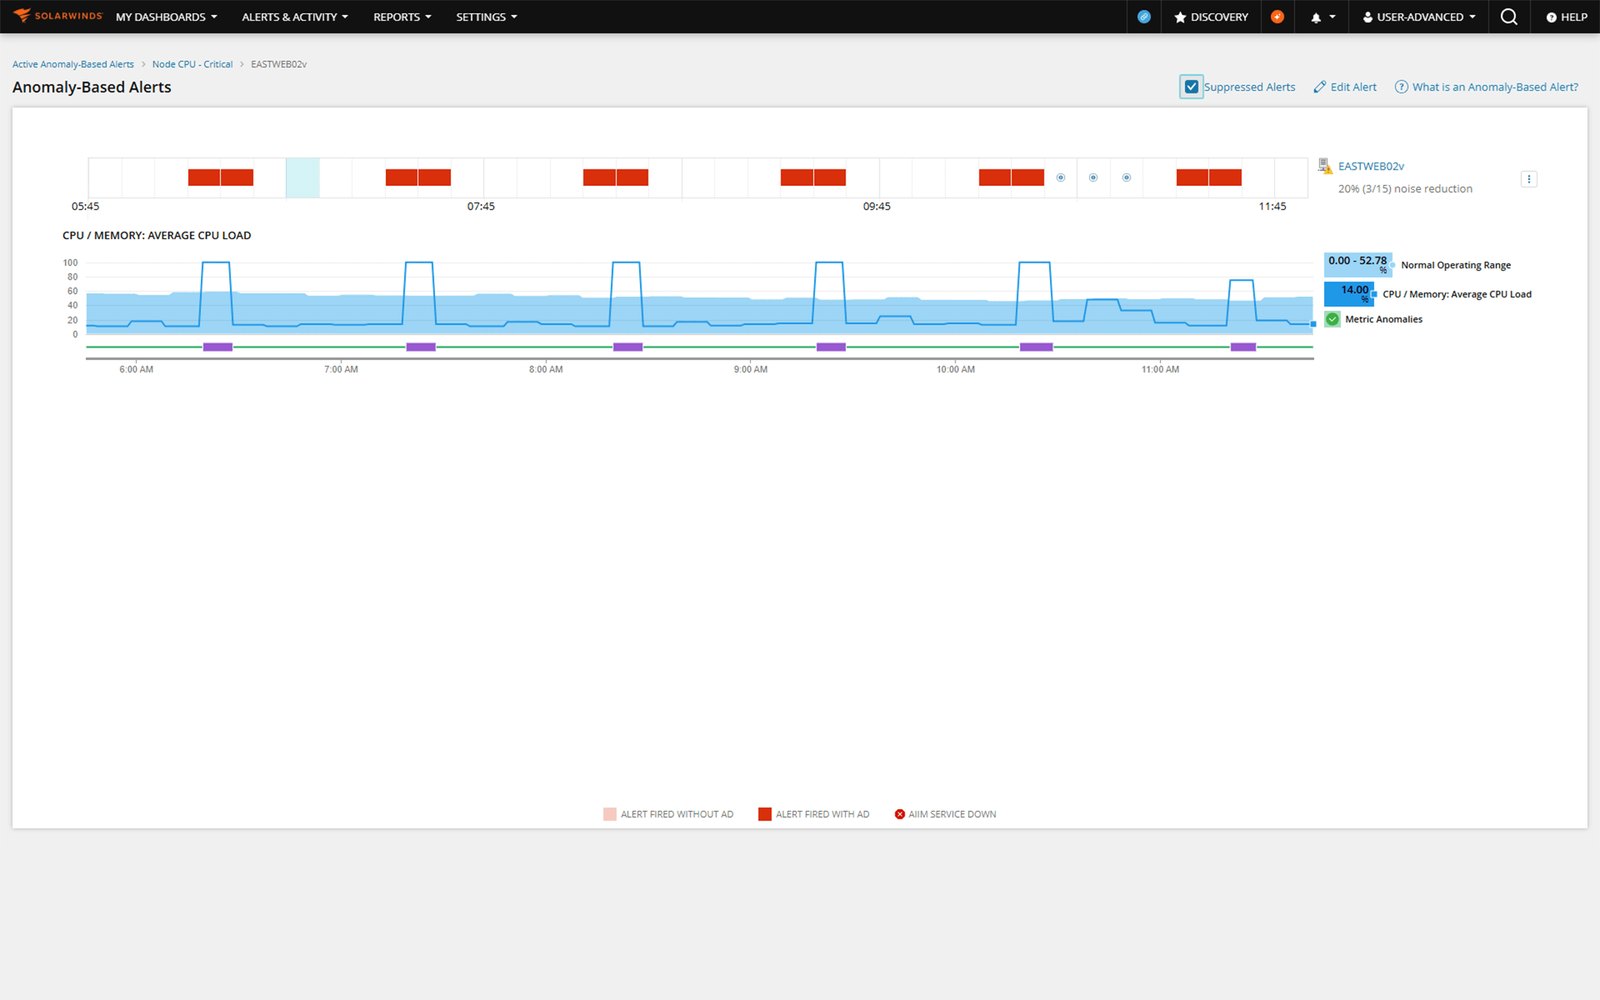
- Anomaly scoring (pandas, NumPy, scikit-learn): anomaly detection and alert analysis components that identify abnormal infrastructure performance patterns, with statistical anomaly scores integrated into monitoring workflows.
- Release quality: automated unit tests, integration tests, code reviews, and CI/CD pipelines, plus regression checks.
Engineering notes
- Why asynchronous polling with retries matters: at thousands of devices, a slow or unreachable device must not stall a polling cycle; asynchronous execution keeps cycles on schedule while configurable retries and fault handling recover transient SNMP/WMI failures instead of leaving gaps in the data.
- Why query tuning matters: historical dashboards and alert investigations read large time-series tables; indexing, stored procedures, and execution-plan analysis keep those reads fast as data grows.
- Why normalize cloud telemetry: AWS and Azure report metrics in different shapes; normalizing and validating them lets cloud resources appear alongside on-premises entities in the same dashboards and reports.
- Why anomaly scores: static thresholds miss slow drifts and over-alert on normal spikes; a statistical score gives administrators a ranked signal of what is genuinely unusual. SolarWinds publicly moved the product in the same direction with AI/ML-powered anomaly-based alerting announced in October 2022.
Gallery
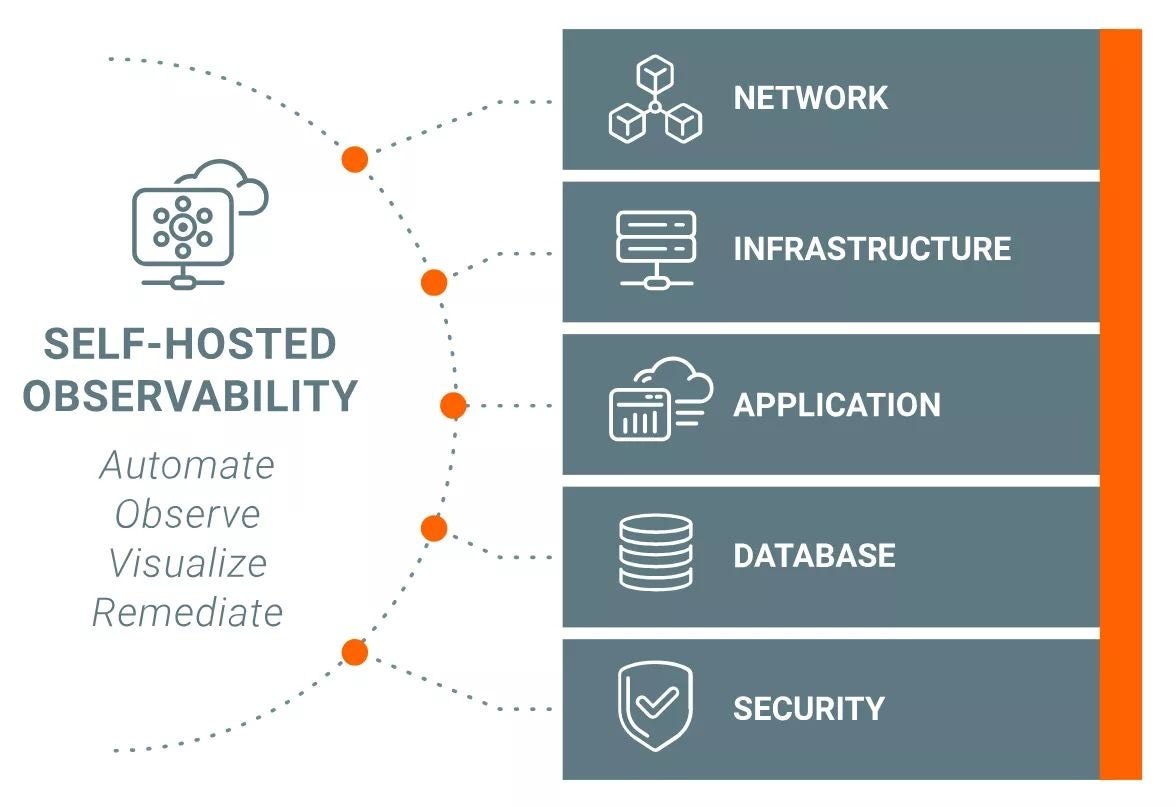
Public product resources
Sources
Company and product facts on this page come from the public sources below. Details of my own work come from my résumé.